What is Data Analysis? An Expert Guide (With Simple Examples)
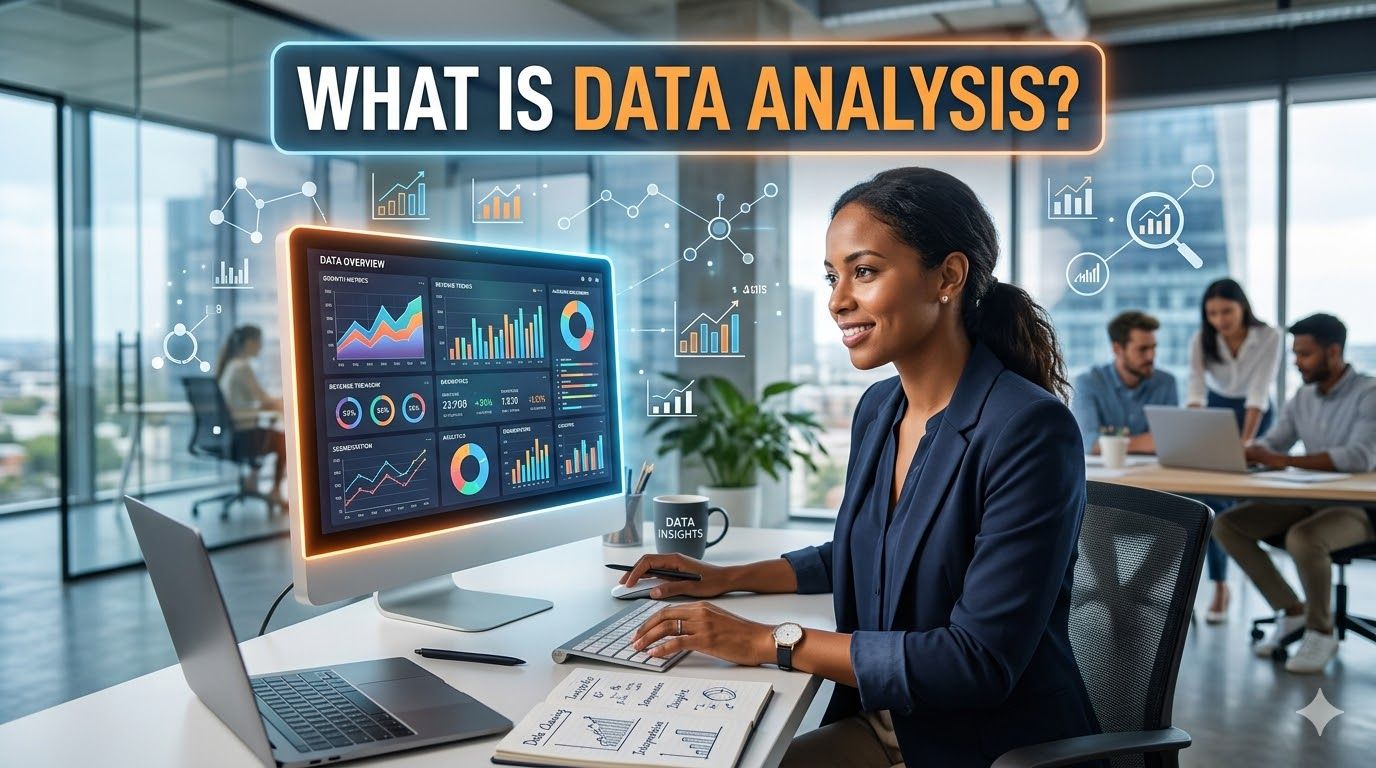
Table of Contents
We live in a world driven by data. Every time you stream a show, order food, or even scroll through social media, you are creating data. But raw data, on its own, is just a bunch of numbers and words—like a pile of unassembled puzzle pieces.
Data Analysis is the process of collecting, cleaning, inspecting, transforming, and modeling data to discover useful information, draw conclusions, and support decision-making. It's the art of turning that pile of puzzle pieces into a clear, actionable picture.
Think of it this way: Data is the "what happened." Data analysis is the "why it happened and what we can do about it."
The Four Types of Data Analysis (With Examples)
Not all analysis is the same. Generally, it falls into four key categories. Imagine you run a small online coffee shop. Here is how you would use each type of analysis:
1. Descriptive Analysis: What happened?
This is the most basic form of analysis. It summarizes historical data to understand what has happened in the past.
Goal: To create metrics and find patterns in raw data.
Example: You look at your sales reports from last month.
Finding: "We sold 500 bags of Espresso Blend and 300 bags of Decaf. Our busiest day was Monday morning."
2. Diagnostic Analysis: Why did it happen?
This takes the insights from descriptive analysis and digs deeper to find the root cause.
Goal: To understand the cause of an event or trend.
Example: You notice sales of your Espresso Blend dropped in the last week.
Finding: You drill down into the data and realize that your supplier was out of stock for three days, so customers couldn't buy it. The "why" is a supply chain issue.
3. Predictive Analysis: What is likely to happen?
This uses historical data to forecast future outcomes. It's about identifying trends and probabilities.
Goal: To predict future trends and events.
Example: Based on last year's sales data and the fact that the weather forecast predicts a hot summer, your model predicts a 40% increase in demand for your Cold Brew coffee beans next month.
Action: You decide to order extra stock now to prepare.
4. Prescriptive Analysis: What should we do?
This is the most advanced stage. It suggests a course of action based on the predictions.
Goal: To recommend specific actions to achieve a goal.
Example: Using your predictive data, the system runs simulations. It suggests that if you offer a "Buy One, Get One 50% Off" deal on Cold Brew beans during the first heatwave, you will maximize revenue by 15% without running out of stock.
🎯 Want to master Data Analysis hands-on?
Learn Excel, SQL, Python & Power BI with real projects at Vika Technologies.
The Data Analysis Process: A Step-by-Step Guide
Following a structured process ensures your analysis is accurate and useful. Here are the five core steps:
Step 1: Define the Question
Before looking at any data, you must know what you are trying to solve. Without a clear question, you risk wandering aimlessly through data.
Example: "Why are our website visitors leaving the shopping cart page without buying?"
Step 2: Collect the Data
Gather the raw data from relevant sources. This could be a company database, a Google Analytics account, a survey, or a spreadsheet.
Example: You export data on website traffic, "add to cart" clicks, and checkout completion rates from your analytics tool.
Step 3: Clean the Data
This is often the most time-consuming step. Raw data is messy. It might have duplicates, errors, missing values, or irrelevant information. Cleaning means fixing or removing these inaccuracies.
Example: You notice that some transactions were recorded in euros and some in dollars. You standardize them all to dollars to ensure a fair comparison.
Step 4: Analyze the Data
Now you apply the statistical or analytical techniques. You look for patterns, correlations, and trends that answer your original question.
Example: You analyze the path users take. You find that 80% of users who reach the cart page leave when they see a surprise "$5 Shipping Fee" pop-up.
Step 5: Interpret and Share the Results
The final step is to translate your findings into a language that everyone can understand. This usually involves data visualization (charts and graphs) and a clear summary of recommendations.
Example: You create a bar chart showing the drop-off rate at the shipping page. Your conclusion: "We need to be transparent about shipping costs earlier in the process to reduce cart abandonment."
A Real-World Example: The Bakery
Let's tie it all together with a simple story.
Scenario: A local bakery wants to increase its profits.
| Type | Question | Finding / Action |
|---|---|---|
| Descriptive | What happened? | They sell 100 croissants every Saturday, but throw away 20 unsold ones every Monday. |
| Diagnostic | Why? | The supplier delivers the same number daily, but weekend traffic is much higher and Monday traffic is very low. |
| Predictive | What will happen? | Last year's trends show pumpkin bread sales increase in October. They predict needing 50% more pumpkin loaves next month. |
| Prescriptive | What should we do? | Reduce Monday croissant orders by 50% to avoid waste, and start a pre-order campaign for pumpkin bread in late September. |
By following this data-driven advice, the bakery reduces waste and maximizes seasonal sales.
Conclusion
Data analysis isn't just for tech giants or data scientists in lab coats. It's a powerful tool for anyone making decisions. By understanding the past (Descriptive), learning why things happen (Diagnostic), preparing for the future (Predictive), and optimizing your strategy (Prescriptive), you can use data to write a more successful story for your business, your career, or even your personal goals.
Note that the quality of your analysis depends entirely on the quality of the data feeding it. If you'd like to understand how clean, validated data actually arrives at the analyst's desk, read our companion guide on the 7 layers of ETL Testing — it's the upstream discipline every senior data analyst should understand.
If you're ready to start your journey in data analysis and want to learn industry tools like Excel, SQL, Python, and Power BI with real-world projects, check out our comprehensive to build job-ready skills with 100% placement support.
Ready to Become a Data Analyst?
Join Vika Technologies for hands-on training with placement support.
About the Author
Vika Tech Team
Industry experts delivering top-notch IT training in Trichy. We specialize in Data Analytics, Engineering, and Full Stack Development.
Frequently Asked Questions
What is data analysis in simple terms?
Data analysis is the process of collecting, cleaning, and examining data to find useful patterns and insights that help in making better decisions.
What are the four types of data analysis?
The four types are Descriptive (what happened), Diagnostic (why it happened), Predictive (what will happen), and Prescriptive (what should we do).
Do I need a coding background to learn data analysis?
No! You can start with tools like Excel and Power BI that require no coding. SQL and Python are taught from scratch in most good courses, making them accessible to beginners.
What tools do data analysts use?
Common tools include Microsoft Excel, SQL databases, Python (with pandas & matplotlib), Power BI, and Tableau for data visualization and reporting.